
MusicMaster Blog
Yeah… We’ve Got a MusicMaster Report For That posted on August 24th, 2010
We get calls and emails fairly often from clients asking us how to create a specific type of report. Perhaps it’s a report that the General Manager or consultant has asked for, or maybe it’s a report you need for reporting purposes to a record label, regulatory agencies, or just internal programming department research or verification.
Our intention in this article is to give a brief “roadmap” as to where in MusicMaster you can locate many of these frequently requested reports, and a brief overview of the options available.
Most Frequently Played Report/Specific spins by criteria
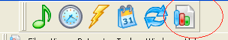
Use the History Browser to create a Most Frequently Played Report, select Database, Analysis, History Browser. Alternately, you can select the graph icon from the toolbar.
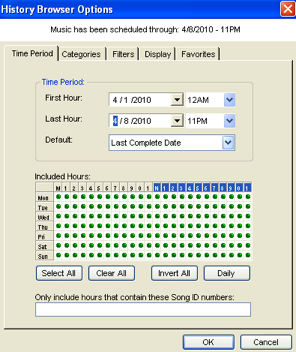
 When the History Browser Options box appears, you’ll have five tabs.
Time Period – Select the one week period you would like for your first report. We’ll assume you want to include all hours in the report, so no other changes are necessary.
 Categories – Make sure there is a check mark on each category you wish to include in the report. We would suggest that you uncheck any non-music categories to keep the report simple.
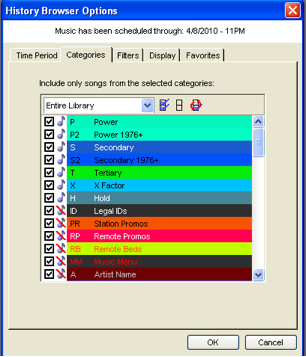
Filters – If you want the weekly spins for your entire library, you do not need to configure anything here. However, if your intention is to create say a report that includes only a specific artist or only a specific record label’s artists, this will be the tab you’ll want to tweak.
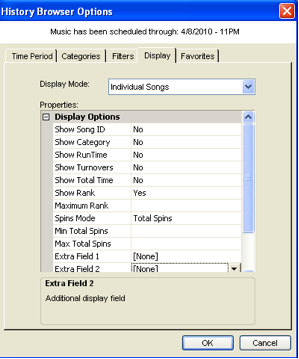
Display – This is where you’ll set up the report. In the Display Mode, we suggest selecting Individual Songs. You can choose to include any of the other Properties listed. We would suggest at least “Show Rank.” Notice there are also Extra Fields so you can include other fields that you may want to see, for instance record label or automation number.
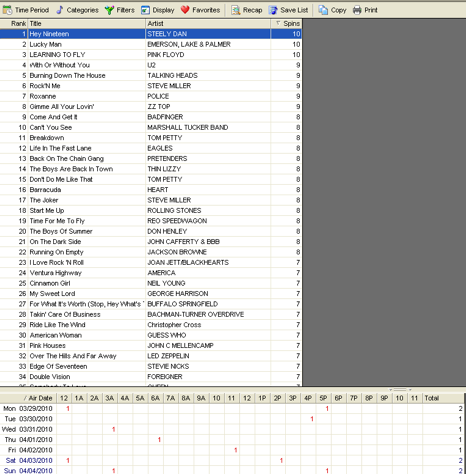
 Here is an example of the resulting report. Note the printer icon. It is also worth noting that this information can be copied and pasted from the screen below into a Word or Excel document if desired.
Artist/Title Analysis
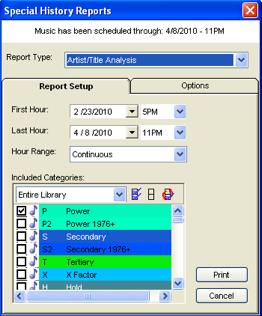
This is an excellent way to get a report of all specific plays by artist and the active titles from that artist in your database. Go to Dataset-Analysis-Special Library REPORTS and select Artist/Title Analysis.
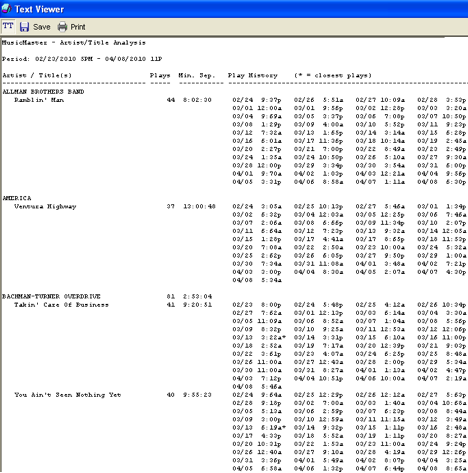
Note the printer choice at the top of this example.
BMI/ASCAP/(other country specific reports)
Far and away, the biggest question we get about reports is the “how to I generate the licensing report for…” While we are highlighting the BMI/ASCAP report template in this article, you will find all of the country licensing and trade report specific reports in this same location. Most important to note on these is the fact that all of the difficult work has already been done for you here with regard to formatting of the report, field specifications, etc. but you MUST configure the fields in the OPTIONS tab, most importantly the ARTIST and SONG TITLE fields, or you will be submitting a blank report to your reporting agency…and we all know how embarrassing that can be!
Go to Dataset-Analysis-Special History Reports and select the report you wish to generate. In this case as noted, we’ve selected the BMI/ASCAP report.
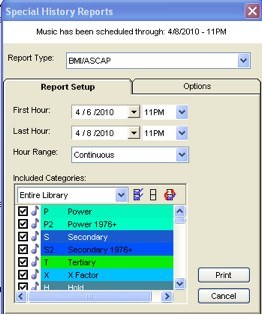 As shown below, remember to assign (AT LEAST) the title and artist fields before generating this report.
 Once you’ve done that, go back to the REPORT SETUP tab and PRINT. If you have any questions about these reports, or find that your specific country designated report is missing, please let us know!
Affidavit Report
Perfect if you need a report for the sales department to show how often a sales related non music element has aired over a specified time. Go to Dataset-Analysis-Special Library Reports and select the
AIRPLAY AFFIDAVIT:
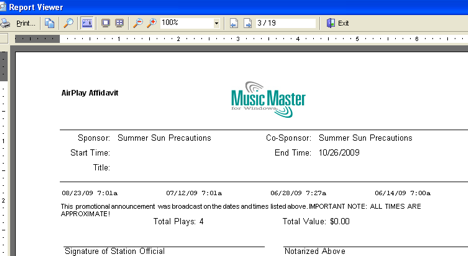
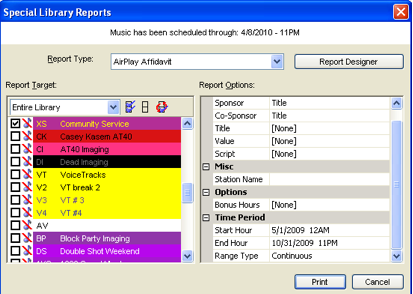 You’ll get a report for each sponsored element and the dates/hours they aired in. Note a value can also be assigned in the database to each as needed. There is also a print box icon that can be selected in the upper left hand corner.
Attribute report
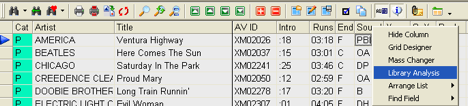
Trying to find out the percentage of “pop” coded songs in your active library or a specific category, or maybe the number of “slow” coded songs? Here’s a quick way to view that (and print it, if desired)Bring up your category or query of songs in library maintenance and select the field you want to get more details about. In the example below, we’ve chosen the sound code. Right click over the grey field header and from the menu that pops up chose LIBRARY ANALYSIS.
 This will give you a report that looks similar to this:
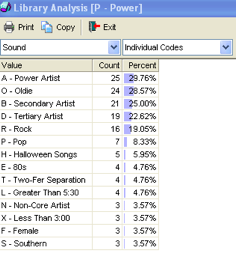 Note the printer icon if you wish to do so.
Here are a few other reports that you might find helpful from time to time:
Move History (of a specific title and/or an entire category)
For a specific song title, go to the song itself in library maintenance (make sure the blue “pointer” arrow on the left is pointing at the song you’d like to review) and from the menu up top, select LIBRARY-
MOVE HISTORY:
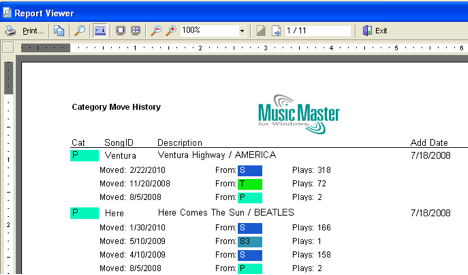
 If needed, you can do a print screen of this individual titles move history. Another option would be to go the context menu of the program itself and select Dataset-Analysis-Special Library Reports and choose CATEGORY MOVE HISTORY for a list of the entire categories move history over the life of the database. Note the printer choice icon here as well.
Format Clock Category Usage
This report is great if you want to get a quick print out of the clock calls for each category on your currently active grid. Go to Dataset-Analysis-Analysis and select the blue musical note in the lower portion of the split screen. (format clock category usage)


Note the printer box in the lower right hand corner.
List of Log notes
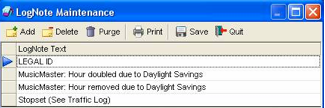
Go to Dataset-Clocks-Lognote Text, here you will see a list of all the log notes that currently exist in the specific database. Note the printer icon, if you want to look at the entire list of log notes outside of the application, select this option.
List of artist trivia notes/list of song trivia
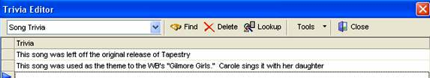
From the menu at the top, select Dataset-Library-Trivia this takes you to the trivia editor for artist and Title. This is the global trivia editor. It allows you to look at song trivia or keyword trivia. The Lookup button will show you what songs or keywords use the line of trivia. The Tools Option contains options to show usage counts for the trivia lines, print the trivia, removed expired trivia and purge unused trivia.
Who’s in the database right now?
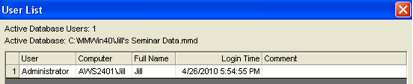
Helpful if your database resides on the network and there are many instances of MusicMaster in multiple locations throughout your facility. Go to Tools-User List.
 As you can imagine, we’ve just scratched the surface on this topic, and there are a multitude of ways to customize and tweak each report to your specific needs. Experiment, and have fun with this!
There is a more in depth video webinar that covers this topic available on our web site. View the topic that is titled “History Browser.”
If there is a specific report that we’ve mentioned today that you have more questions about, or you have an idea about one you’d like to create in the program (or perhaps have our developers consider creating for you if it doesn’t already exist) please get in touch, we’d love to talk with you about it!